


Cross-app dashboards in Zoho Analytics work through one shared workspace
Cross-app dashboards in Zoho Analytics work for Zoho CRM, Desk and Books data. You sync each app into the same Analytics workspace and link the tables on a shared customer field. You then build reports from the joined data and place them on one dashboard. The charts are the easy part. The data model decides whether the numbers are right.
A cross-app dashboard is a single Zoho Analytics dashboard whose reports draw on data from more than one business app. Sales, service and cash then appear on one screen. Zoho describes Zoho Analytics as an on-demand reporting and business intelligence solution. According to Zoho's Advanced CRM Analytics page, it can pull information from databases, files, third-party business applications and multiple Zoho apps.
This guide covers the connection, the shared customer key and the Query Tables that combine the data. It then works through an example. After that come the data-model mistakes we see when companies build these dashboards themselves, the sync and access settings to check, and what a UK firm should look at before committing.
What Zoho CRM, Desk and Books each contribute to one dashboard
Each of the three apps holds one part of the customer story, and none holds all of it. Zoho CRM holds the sales side: accounts, contacts and the deals in your pipeline. Zoho Desk holds service: the tickets customers raise and how your team handles them. Zoho Books holds cash: the invoices you raise and the payments you receive.
Combining the three apps answers questions that none of them answers alone. Which large accounts also raise the most tickets? Which customers with open deals still owe you money? Zoho calls this cross-functional analysis. Its own example is comparing marketing campaign statistics with sales reports.
Combining data is a common sticking point even inside one app. A user on Zoho's community forum wanted a CRM dashboard "crossing information from 3 modules" and asked whether CRM Dashboards could do it. Once the question spans CRM, Desk and Books, Zoho Analytics is the tool for the job. Our post on choosing between Zoho CRM reports and Zoho Analytics covers that decision in more detail.
Connecting each Zoho app into the same Analytics workspace
You connect Zoho CRM, Desk and Books to Zoho Analytics one app at a time, and each connection must import into the same workspace. A workspace is the container in Zoho Analytics that holds your tables, reports and dashboards. A Query Table can only combine tables that sit in the same workspace. A new user on Zoho's community forum noticed the one-at-a-time pattern and asked whether several Zoho apps could be combined at all. They can, once their tables share a workspace.
Zoho lists more than 10 integrated Zoho products, naming Zoho CRM, Zoho Projects and Zoho Finance among them. Zoho Books belongs to the Finance group. Check the connector list in your own account for each app before you plan the dashboard.
Three rules from Zoho's connector help pages shape the set-up:
- Only the Account Administrator and Organization Administrators can set up an Advanced Analytics connector.
- After you configure a connector, the connection can take about five minutes to establish.
- You cannot add or change data in the synced tables, or add new columns, but you can add formula columns and aggregate formulas.
The read-only rule matters for the design of a cross-app dashboard. Every calculation you need lives in a formula or a Query Table, never in the source tables. Plan those calculations before you build any reports.
The shared customer key that joins CRM, Desk and Books
A shared customer key is the column that identifies the same customer in all three apps, and every cross-app report depends on it. Zoho Analytics links tables through lookup relationships. A lookup relationship tells Analytics that a column in one table refers to a column in another. An example is a customer reference on an invoice pointing to the customer table.
Do not expect Zoho Analytics to create the links between apps for you. Zoho's help pages for its Teamwork Desk and SurveyMonkey connectors state that a lookup relationship "will not be created automatically" with the modules of another application you import. You link them manually. Assume the same work for CRM, Desk and Books, and check every link once it is set.
Choose the customer key with care. A system identifier that both apps carry is the safest choice. A company name is fragile: "Acme Ltd" in CRM and "ACME Limited" in Books will never match. Duplicate records cause the same problem, because one customer appears as two.
Clean duplicates at source, before the data reaches Analytics. Our guide to importing data into Zoho CRM without breaking your records covers keeping customer records clean on the way in.
Query Tables, formulas and pipelines for combining the data
A Query Table is a table that pulls data from other tables using standard SQL SELECT queries, and you build reports over it as over any data table. It is the main tool for a cross-app dashboard. One Query Table can bring CRM accounts, Desk tickets and Books invoices into a single view per customer.
Formulas handle the metrics. Zoho describes formulas as calculations that derive key business metrics for reporting and analysis. A formula column works row by row. An aggregate formula works across rows, such as a count or a rate.
The Teamwork Desk connector, for example, ships a default Satisfaction Rate. It divides tickets rated "great" by all tickets rated "great", "bad" or "ok", then multiplies by 100. Advanced CRM Analytics adds pre-built arithmetic and statistical functions, and you can define your own formulae.
Two features from the Zoho Analytics 6.0 announcement help on larger set-ups:
- Data pipelines, on the Premium Plan, built in a no-code visual builder with join, append, pivot and unpivot transforms.
- Unified Metrics, which consolidates and standardises the metrics from different data sources and tables in a workspace.
Unified Metrics suits a cross-app dashboard well. A metric such as "open tickets" or "invoiced revenue" then means one thing on every report, whichever app the data came from.
Worked example: one dashboard showing sales, service and cash per customer
This worked example builds one dashboard showing each customer's open pipeline, open tickets and unpaid invoices side by side. The workspace name is an example. Your tables will carry the names your connectors give them.
- Create the workspace. Give it a plain name, such as "Sales service cash".
- Connect the three apps. As an administrator, set up the Zoho CRM, Zoho Desk and Zoho Books connectors, each importing into that workspace. Allow a few minutes for each connection to establish.
- Link the customer key. Set a lookup from the customer column in the Desk and Books tables to the CRM account table.
- Summarise each app first. Build one Query Table per app that returns a single row per customer: open deal value, open ticket count or unpaid invoice total.
- Join the summaries. Build a final Query Table that joins the three summaries on the customer key.
- Build the reports. Use a tabular view for the customer list, a chart for ticket volume and a pivot table for invoices by month.
- Assemble the dashboard. Drag the reports into the layout and add KPI widgets for the three headline totals.
Zoho's help pages list 6 types of single-number KPI widget and 2 chart-type widgets. On the finished dashboard, clicking a single data point opens the underlying records in a spreadsheet layout. A manager who spots a customer with heavy ticket volume can see the tickets behind the number without leaving the screen.

Data-model mistakes we see when companies build cross-app dashboards themselves
Most broken cross-app dashboards fail in the data model, not in the charts. The figures look plausible, so nobody questions them until a director compares them with Zoho Books. The table below lists the mistakes we meet most often, how each shows on screen and the fix.
| Mistake | What you see | Fix |
|---|---|---|
| Joining on customer name | Customers split in two or missing from totals | Join on an identifier both apps carry |
| Joining raw rows from two apps | Invoice totals inflated for customers with many tickets | Summarise each app per customer, then join |
| Expecting automatic links | Cross-app reports with no matching rows | Set lookup relationships manually |
| Mismatched sync timing | Figures from different moments side by side | Align sync intervals for tables on one dashboard |
| Calculations in synced tables | Attempts to add columns fail | Use formula columns or Query Tables |
| Duplicate records at source | The same customer counted twice | Merge duplicates in the source app first |
Joining raw rows causes the worst errors. Join a customer's tickets to their invoices row by row and each invoice repeats once per ticket. The invoice total grows with the ticket count, and nothing on the dashboard warns you.
At Svennis we agree the shared customer key with the sales, service and finance leads before we connect any app. We then test the joined totals against the Books figures before anyone sees the dashboard, and that check catches most of the mistakes in the table.
Sync schedules, failures and keeping the combined figures fresh
Synced data is only as current as the last import, so sync timing is part of the data model. The interval you can choose depends on the connector and your plan. Zoho's help pages for two connectors show the range. The Teamwork Desk connector offers 3, 6 or 12 hours. For the SurveyMonkey connector, only the Enterprise plan can sync every hour, and the Basic plan syncs once a day.
Since Zoho Analytics 6.0, each table can have its own sync interval instead of one interval per source. That helps a cross-app dashboard. Set the tables on one dashboard to compatible intervals, so a won deal and its invoice are not hours apart.
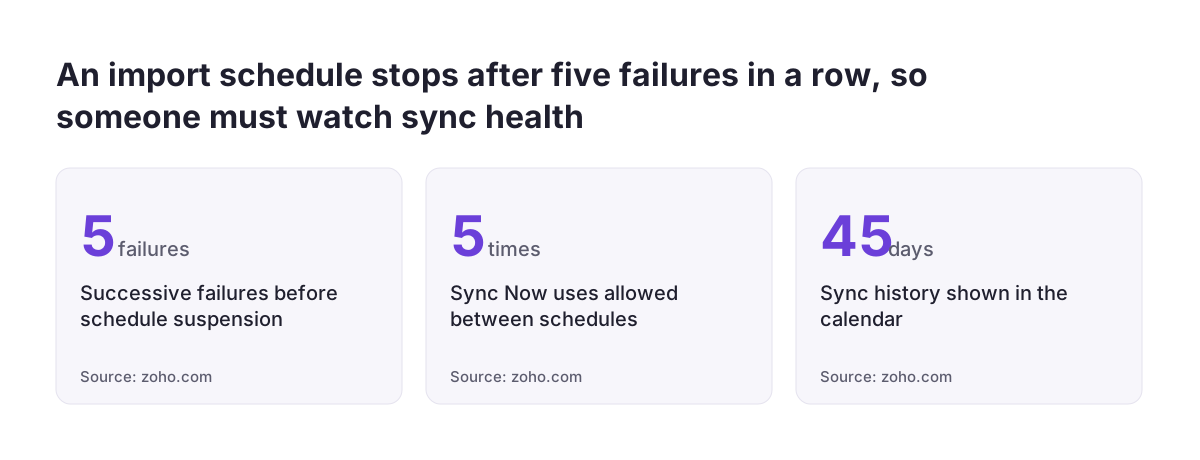
Sync failures need watching. Zoho's connector help pages state the following:
- The import schedule is suspended after five successive failures.
- Sync Now pulls recent data and can be used at most five times between scheduled syncs.
- Full Data Fetch replaces all existing data in Zoho Analytics with the full set from the source.
- A calendar shows the sync history for the last 45 days.
On the Enterprise Plan, Undo Import reverts the current import version to the previous one without affecting the existing data flow. That matters when a bad import reaches a dashboard your directors read.
Who can see the combined data, and how sharing affects licences
A cross-app dashboard puts sales, service and finance data in one place, so access needs more thought than for a single-app report. Zoho Analytics has three user roles: Administrator, Workspace Administrator and User. For the Teamwork Desk connector, tables and reports are visible by default only to the administrator who configured it. Plan to share deliberately rather than by accident.
The sharing options for Zoho Analytics dashboards and reports include:
- Sharing with individuals and groups at different permission levels.
- Embedding static or interactive live reports in an intranet, which update when the data changes.
- IP restrictions at workspace level, added in 6.0, where before they applied only to the whole account.
Sharing has a licence cost. For pricing, Zoho defines a user as anyone you privately share databases, tables, reports or dashboards with, identified by their email address. A dashboard shared with every account manager adds every account manager to your user count. Decide the audience before you share the cross-app dashboard.
What a UK company should check before committing to Zoho Analytics
UK firms can check Zoho Analytics against its G-Cloud 14 listing on the Digital Marketplace. The listing gives a price range of £24 to £460 a licence a month, with a free trial available.
The G-Cloud listing records these points worth reading before you sign:
- Data storage and processing take place in the European Economic Area.
- ISO/IEC 27001 certification, accredited by BSI on 22 September 2023.
- No Cyber Essentials or Cyber Essentials Plus certification.
- A stated monthly uptime of 99.9%, with service credits on request.
- Phone and web chat support from 9 to 5 UK time, Monday to Friday.
- Analytical insights and data entities kept for 120 days after a downgrade at contract end.
If your clients ask suppliers for Cyber Essentials, raise that gap early. The free plan gives 2 users and 10K rows, with unlimited reports and dashboards. It excludes scheduled reports and augmented analytics. Rows count across every table in the account, so customer, ticket and invoice history from three apps adds up. Test the free plan on a sample rather than your full data.
Next steps for your first cross-app dashboard in Zoho Analytics
Start small: one question, three apps, one dashboard. These steps keep the first build manageable:
- Write down the single question the dashboard must answer, such as which customers have open deals and unpaid invoices.
- Agree the shared customer key with sales, service and finance, and merge duplicates at source.
- Connect CRM, Desk and Books into one workspace and set the lookups manually.
- Summarise each app per customer in a Query Table before joining.
- Check the joined totals against Zoho Books before anyone relies on them.
- Set sync intervals and decide who sees the dashboard, counting the licence impact.
For an overview of the platform before you start, see our Zoho Analytics page for UK firms.
Sources
- Zoho CRM: Advanced CRM Analytics
- Zoho Community: CRM Dashboards - 3 modules
- Zoho Community: Combining Data from Multiple Zoho Apps?
- Zoho Analytics Help: Survey Monkey Connector
- Zoho Analytics On-Premise: Teamwork Desk
- Zoho Community: Announcing Zoho Analytics 6.0
- Digital Marketplace: Zoho Analytics G-Cloud listing