

Zoho CRM reports or Zoho Analytics: the short answer
For Zoho CRM reports or Zoho Analytics: which you need, the answer turns on your data. Stay with Zoho CRM reports when your questions are about sales data already held in CRM. Add Zoho Analytics when you need data from outside CRM, such as billing or finance. It also earns its place for deeper modelling, history over time, or reports for people who do not use CRM.
Zoho Analytics is a reporting and business intelligence tool from Zoho. Business intelligence, or BI, means pulling data from several systems into one place so you can model it and report on it. Zoho includes Analytics in Zoho One. You can also buy it on its own.
Zoho draws the line in the same place. Its May 2026 blog post, The next layer of analytics for your Zoho CRM data, says CRM is focusing on "intelligence inside the sales workflow". Analytics, it says, is "evolving around deeper cross-functional analysis". This guide turns that split into a decision you can make for your own firm.
This post is the first of three on Zoho Analytics. It covers when CRM's own reports are enough and when Analytics is worth the cost. The other two posts in the set go further into Analytics itself. If you want to know which CRM reports a director will actually read, the existing post "CRM Reports Directors Actually Read and How to Build Them in Zoho" covers that. This guide does not repeat it.
What Zoho CRM reports, dashboards and forecasts already cover
Zoho CRM ships with a large set of ready-made reports, organised by module. According to Zoho's guide to reports and dashboards in Zoho One, they work as soon as you set up the account and enter sales data. A module is a record type in CRM, such as Leads, Contacts or Deals.
Custom reports in Zoho CRM follow a fixed pattern:
- Choose a primary module, the main record type the report is about.
- Optionally add related modules.
- Select columns, which are the fields in those modules.
- Apply filters.
- Group or aggregate the results.
Zoho lists five built-in capabilities that already cover most day-to-day sales questions:
- Standard and custom reports across every module, with filters, groupings and aggregations.
- Dashboards for sales managers and leadership, refreshed in real time.
- Forecasting by user, role, hierarchy or territory, with quota tracking built in.
- Zia predictions: lead scoring, deal win probability, anomaly detection on KPIs, best time to contact and email sentiment.
- A report scheduler that emails XLS files to users, roles or teams daily, weekly, monthly or yearly.
Scheduled CRM reports can go out by email, Zoho Cliq or Cisco Webex. You can also export any report as PDF, XLS or CSV. For a sales team that lives in Zoho CRM, this covers pipeline, activity, conversion and quota without a second product. If the reports feel thin, the fix is often better fields and layouts, which customising your CRM covers.
Where Zoho CRM reports stop: the limits Zoho names itself
Zoho CRM reports are built entirely on data stored in Zoho CRM. The Zoho One guide says so directly. They do not include financial, marketing or other data. Zoho's blog adds that CRM "can't reach your billing system, ad platforms, or product database."
Zoho's blog names five situations where it recommends Zoho Analytics instead of CRM reports:
- Data from outside CRM. Billing, marketing, product or finance data. Analytics connects to over 250 sources and can blend Zoho apps with third-party apps.
- Deeper modelling. Questions such as where deals stall by stage, rep and product line need data modelling, custom formulas and SQL access. SQL is the standard language for querying databases.
- Cohort analysis. A cohort is a group of records that share a starting point, such as all deals opened in January. Zoho's blog lists cohort analysis among the questions that need a BI platform.
- Reach beyond CRM users. People who never log into CRM still need to see the numbers.
- Embedding and white-labelling. Putting dashboards inside your own product or giving them to customers under your brand.
History is a sixth limit, and it matters at month-end. A CRM dashboard shows the pipeline as it stands now. It cannot show what the pipeline looked like on the last day of last month. Zoho Analytics handles that with data snapshots.
A data snapshot is a stored copy of a report's data at a set point in time, so you can track trends. Data snapshots are available on the Standard plan and above.
Zoho's own pages also differ on forecasting. The Zoho One guide says CRM "can do some forecasting" and calls Analytics more robust. The blog lists CRM forecasting by user, role, hierarchy and territory with quotas. The cautious reading is to treat CRM forecasting as right for quota tracking. For modelled forecasts, look to Analytics.
Decision table: CRM reports or Zoho Analytics, question by question
The quickest way to decide is to write down the questions you ask each month and test each one. The table below maps common reporting needs to the tool Zoho's own pages point to.
| Your reporting need | Zoho CRM reports | Zoho Analytics |
|---|---|---|
| Pipeline, activity and conversion from CRM data only | Yes, with real-time dashboards | Possible, but not needed |
| Quota tracking by rep, role or territory | Yes, built into forecasting | Not needed |
| Lead scoring and deal win probability | Yes, through Zia predictions | Not needed |
| CRM data joined with finance, billing or marketing data | No, CRM data only | Yes, over 250 sources |
| Cohorts, custom formulas or SQL | No | Yes, with SQL query tables on every plan |
| Month-end or weekly history of a report | No | Yes, data snapshots on Standard and above |
| Reports for people who do not use CRM | Scheduled XLS by email, Cliq or Webex | Viewers, shared links and scheduled dashboards |
| Dashboards embedded in a webpage or product | No | Yes, including white-labelling |
If every row you care about sits in the CRM column, you do not need Analytics yet. If one or two rows sit in the Analytics column, test those questions on the trial first. The work that sits behind this table is data analytics: turning raw records into answers you can act on.
Example one: a director who wants CRM pipeline and Books cash on one page
A UK managing director wants a single page each Monday. It should show open pipeline from Zoho CRM next to cash position and overdue invoices from Zoho Books. CRM reports cannot do this, because they use CRM data only.
Zoho Analytics can. It imports data from Zoho applications and blends them with third-party apps. Zoho's blog shows an Analytics dashboard joining Zoho CRM and Zoho Desk data into one cross-functional view. The same approach applies to CRM and Books: each app becomes a set of tables in an Analytics workspace, and one dashboard reads from both.
Two plan details matter for this director:
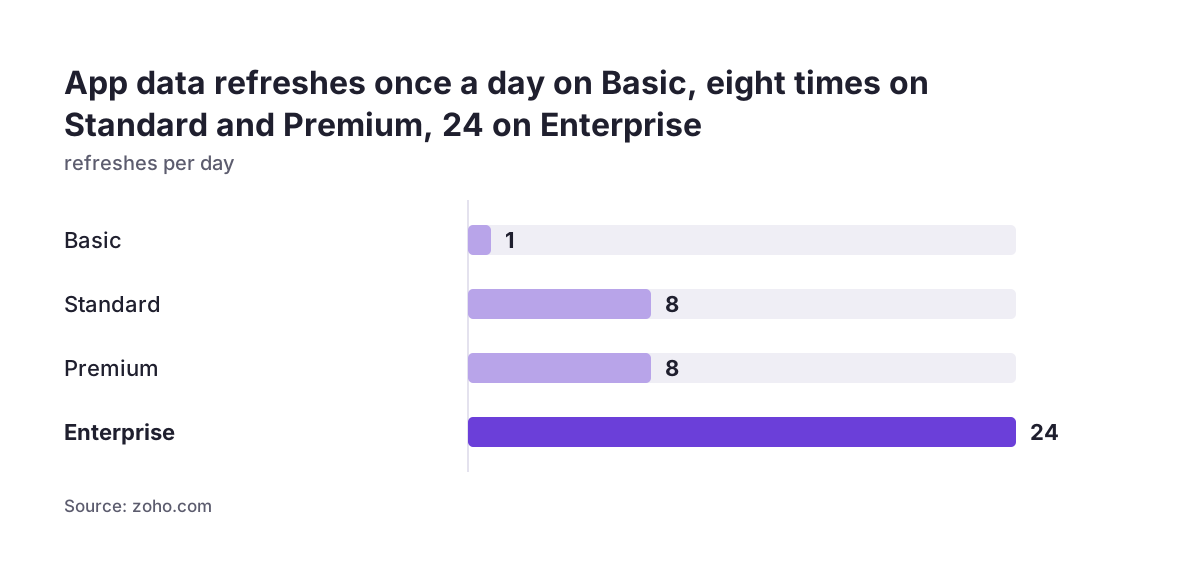
- Refresh rate. Data from business apps refreshes once a day on Basic and eight times a day on Standard and Premium. A Monday-morning page is fine on Basic. A page checked through the day is not.
- Who sees it. The director can be a Viewer. Zoho defines a Viewer as someone who can view and explore shared reports through a secure login but cannot create or share them.
Analytics can also email the dashboard to the director on a daily, weekly or monthly schedule. Delivery can go by email, Zoho Cliq or platforms such as Slack. That removes the need to log in at all.
Example two: a sales manager whose CRM dashboard is enough
A sales manager at a UK distributor runs a team of eight. The weekly questions are simple. What is in the pipeline by stage? Which reps are behind quota?
Which deals have not moved in a fortnight? Every one of those answers sits in the Deals module of Zoho CRM.
For this manager, Zoho CRM's own reports are enough. Dashboards refresh in real time. Forecasting tracks quota by user or territory. Zia flags deal win probability and anomalies on KPIs. A scheduled report can email an XLS summary to the team every Monday.
Adding Zoho Analytics here would add cost and a second place to maintain. It would also add delay. On the Basic plan, data from business apps refreshes once a day, which is slower than the CRM dashboard the manager already has.
The test that keeps this manager honest is a list of questions, not a list of features. At Svennis we start every reporting brief by writing down the questions the team asks each month and checking which fields in CRM answer each one; only when an answer needs data that CRM does not hold do we propose Analytics. Often the gap is a missing field or a poorly used stage, which the intermediate Zoho CRM guide helps you fix inside CRM.
Example three: month-end snapshots for a firm that needs history
A UK services firm reports pipeline value to its board every month. The board wants to compare this month-end with the last twelve. Zoho CRM shows only the current state. Zoho Analytics data snapshots keep the history.
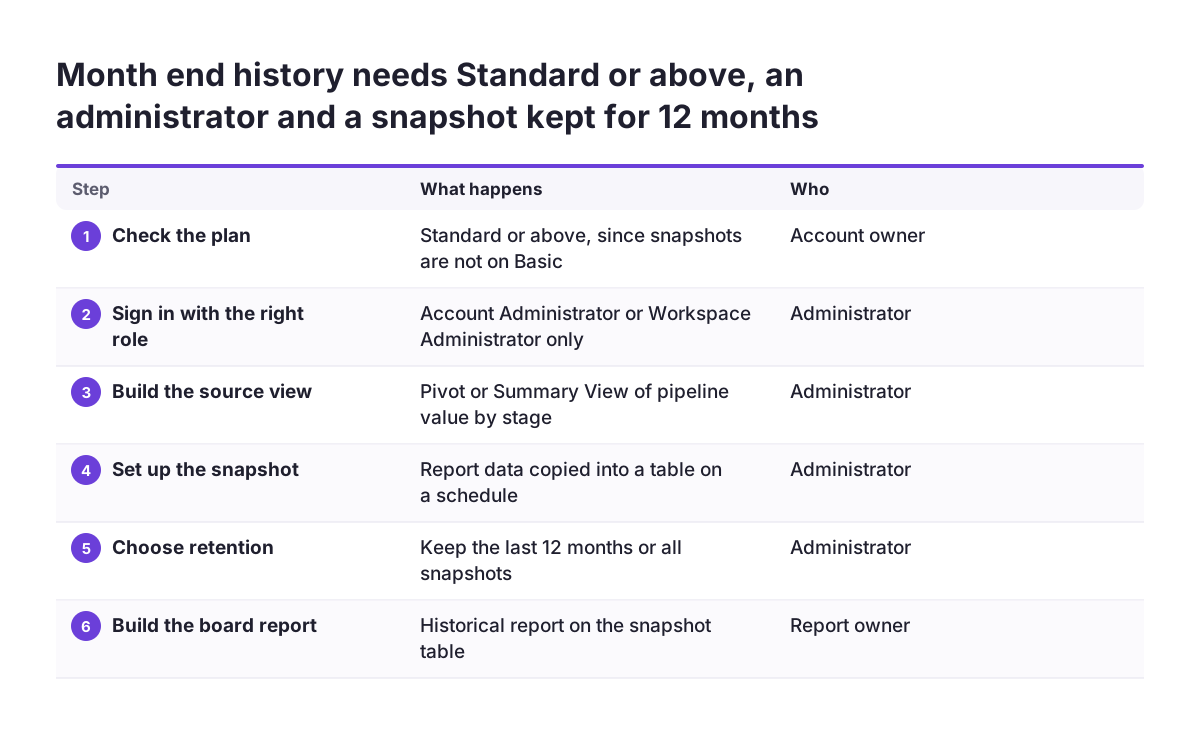
Data Snapshot, according to Zoho's Data Snapshot help page, periodically copies data from a chosen report into a table. You then build historical reports on that table. Here is how the firm would set it up, using the settings that page describes:
- Confirm the plan is Standard or above, because snapshots are not on Basic.
- Sign in as the Account Administrator or a Workspace Administrator. Only they can set up snapshots.
- Build a Pivot View or Summary View of pipeline value by stage. Snapshots work on Charts, Pivot Views and Summary Views, but not on a Pivot View with Column grouping.
- Schedule the snapshot monthly. Hourly, daily and weekly are also available, or you can run it manually.
- Set retention to Last 12 Months, or All Snapshots if the board wants more. Older data outside the span is removed.
Three rules catch people out later:
- After you create a snapshot, you cannot remove a column or change its summary function. You can still add or rearrange columns.
- You cannot edit or delete data in a snapshot table.
- If you disconnect a snapshot, you cannot reconnect it to that table. The existing data stays readable.
Design the report carefully before the first snapshot runs. A deleted snapshot stays in Trash for 45 days, and deleting it also deletes its dependent views.
Zoho Analytics plans, users, rows and refresh rates that affect the decision
Zoho Analytics plans are sized by users and rows. A row is a record in a table. The row count is the sum of all rows across all tables in all workspaces in the account. Zoho says one million simple rows equals about 1GB or more, depending on columns and data types.
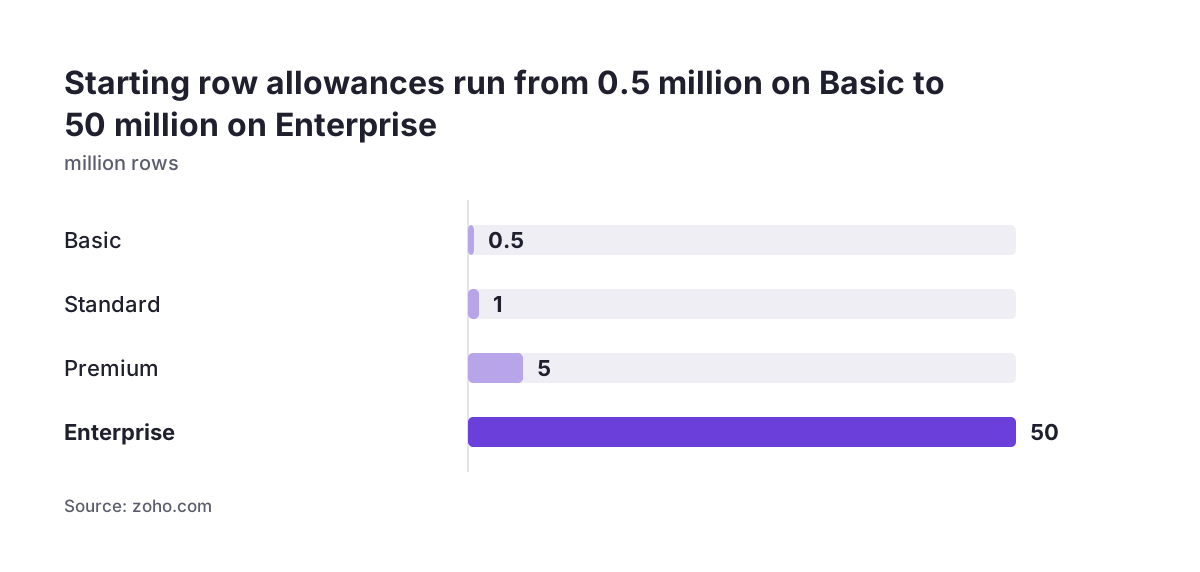
The starting sizes on the Zoho Analytics pricing page are:
| Plan | Starting users | Starting rows | App data refresh | SQL query tables |
|---|---|---|---|---|
| Basic | 2 | 0.5 million | 1 a day | 25 |
| Standard | 5 | 1 million | 8 a day | 50 |
| Premium | 15 | 5 million | 8 a day | 100 |
| Enterprise | 50 | 50 million | 24 a day | 500 |
A Free Plan also exists, with 2 users, 10K rows, 5 workspaces and unlimited reports and dashboards. That is enough to test a question, but not to run a business on Books and CRM data.
Two points decide the plan for most firms. Snapshots need Standard or above. A dashboard read several times a day needs more than Basic's single daily refresh.
Analytics also offers an MCP server, which lets AI models, AI agents and MCP clients work with your Analytics data. If you are weighing AI for reporting beyond Zia, check that feature on the pricing page against your plan.
What the Zoho Analytics decision means for a UK firm
For a UK firm, the cost decision starts with the Zoho Analytics pricing page. Check it on the day you decide, because plans and prices change. Zoho states that local taxes such as VAT are charged on top of the listed prices. Budget for VAT when you compare Analytics with the CRM reports you already pay for.
Billing terms are flexible. Zoho describes Analytics as a month-to-month, pay-as-you-go service that you can upgrade, downgrade or cancel at any time. Yearly billing saves 20% against monthly. A sensible path is to start monthly and switch to yearly once the dashboards are in regular use.
Check whether you already own it. Zoho Analytics is included in Zoho One. If your firm runs on Zoho One, the question is not whether to buy Analytics. The question is whether your reporting needs justify the time to build it. Svennis's Zoho Analytics page sets out what that build involves.
Sharing needs thought under UK data protection rules. Analytics public views can be shared by password-protected link, private link within your organisation, or a fully public web link. Embedded reports can be viewed without logging into Analytics. For anything holding customer or financial data, choose the password-protected or private link. Keep fully public links for data you would publish anyway.
Next steps: test your reporting questions before you buy Zoho Analytics
The practical next step is to test your real questions, not to compare feature lists. Follow this order:
- Write down the five to ten questions your managers and directors ask each month.
- Mark each one against the decision table above: CRM data only, or CRM plus something else.
- Build the CRM-only questions as Zoho CRM reports and dashboards first.
- If any question needs Books, marketing or other data, start the Zoho Analytics 15-day free trial. No credit card is needed.
- If the board wants month-end history, test data snapshots on the trial before you commit. Snapshots need Standard or above once the trial ends.
- Count your rows and viewers, then pick the smallest plan that fits.
If every question passes step two as CRM-only, stop there. Your CRM reports are enough, and you save the cost of a second tool. If you are still unsure what good CRM reporting looks like, the basics of Zoho CRM is a useful place to start.
If Analytics comes out ahead, read how Svennis approaches Zoho Analytics for UK firms. Bring your list of questions to that conversation. It is the fastest way to scope the work.